Job resource monitoring tool (Grafana)
You're working with powerful High-Performance Computing (HPC) resources managed by SLURM, and you have access to a Grafana dashboard that provides detailed metrics about your jobs, thanks to an nvitop exporter. This guide will help you understand these metrics and use them to make your Artificial Intelligence (AI) and Machine Learning (ML) workloads run more efficiently. Note that CPU-only jobs are also shown but without any GPU information.
After every job executing you'll get an URL with the specific job details.
You can also access the dashboard here
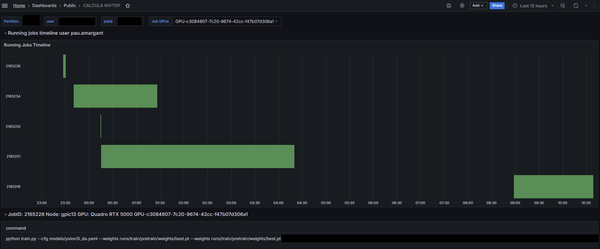
Selecting the partition (research group) and the user you can adjust the time span in order the running jobs:

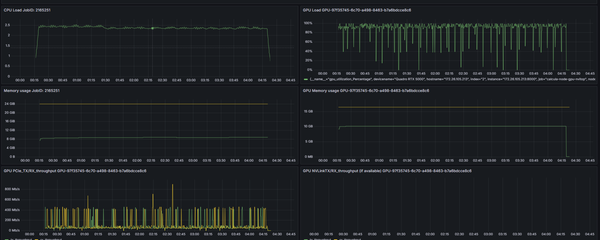
Then we can look for a detailed job usage resource if we select the SLURM jobid and one of the GPU(s) involved on the job. On the bottom section it will appear these metrics:

Let's explain these metrics:
CPU Load (Central Processing Unit)
- What it is: CPU load indicates how busy the CPU cores assigned to your job are. A load of 1.0 on a single core means it's fully utilized. If your job has 8 cores, a load of 8.0 means all 8 cores are fully busy.
- Why it matters for AI:
- Data Preprocessing: Tasks like loading data, augmenting images, tokenizing text, and transforming features are often CPU-bound.
- DataLoaders: In frameworks like PyTorch or TensorFlow, DataLoader workers use CPU cores to prepare batches of data for the GPU.
- Overall Orchestration: Even if the core computation is on the GPU, the CPU manages the overall process.
- What to watch for in Grafana:
- Low CPU load with low GPU load: Could indicate a bottleneck elsewhere (e.g., slow disk I/O) or an inefficient data pipeline.
- High CPU load with low GPU load: Your CPU might be the bottleneck, unable to feed data to the GPU fast enough.
- CPU load matching requested cores: Ideal if the CPU is doing significant work.
GPU Load (Graphics Processing Unit)
- What it is: GPU load (often shown as "GPU Utilization" or "SM Activity") measures how much of the GPU's computational capacity is being used. This primarily reflects the activity of the Streaming Multiprocessors (SMs) that perform parallel computations.
- Why it matters for AI: GPUs are the workhorses for deep learning, excelling at the matrix multiplications and tensor operations fundamental to training and inference.
- What to watch for in Grafana:
- Low GPU load: This is a common sign of inefficiency. Your expensive GPU isn't being used to its full potential! This could be due to:
- CPU bottleneck (data not arriving fast enough).
- Small batch sizes.
- Inefficient GPU code or operations.
- I/O bottlenecks.
- High GPU load (e.g., >90%): Generally good, indicating your GPU is busy. However, ensure this is productive work and not, for example, waiting on GPU memory transfers constantly.
Memory (RAM) Usage
- What it is: This is the main Random Access Memory of the compute node your job is running on (green line). Your job requests (yellow line) a certain amount of this memory from SLURM.
- Why it matters for AI:
- Storing Datasets: Small to medium datasets might be loaded entirely into RAM.
- Holding Program Code & Variables: Your Python script, libraries, and intermediate variables consume RAM.
- Data Buffers: Data is often buffered in RAM before being sent to the GPU.
- What to watch for in Grafana:
- Memory usage approaching your SLURM request limit (yellow line): If your job exceeds its requested memory, SLURM might terminate it (Out-Of-Memory error).
- Very low memory usage compared to request: You might be over-requesting memory, making it unavailable for other users.
- Steadily increasing memory usage (Memory Leak): If memory usage climbs over time without stabilizing, your code might have a memory leak.
GPU Memory Usage
- What it is: Each GPU has its own dedicated high-speed memory (VRAM). Each GPU model has its own limit (yellow line). This is separate from the system RAM.
- Why it matters for AI:
- Model Parameters: The weights and biases of your neural network are stored here.
- Activations: Intermediate outputs during the forward and backward passes are stored in GPU memory.
- Data Batches: The current batch of data being processed is transferred to GPU memory.
- What to watch for in Grafana:
- GPU memory full (or close to it): This is a common bottleneck. If you try to fit too much (large model, large batch size), you'll get an Out-Of-Memory (OOM) error on the GPU.
- Low GPU memory usage with low GPU load: Could indicate your batch size is too small, or the model itself is small, and you're not leveraging the GPU's capacity.
PCIe Rx/Tx Throughput (Peripheral Component Interconnect Express)
- What it is: PCIe is the high-speed interface connecting the GPU to the motherboard (and thus to the CPU and system RAM).
- PCIe Tx (Transmit): Data sent from the CPU/System RAM to the GPU memory (e.g., input data batches, model parameters if not already there).
- PCIe Rx (Receive): Data sent from the GPU memory to the CPU/System RAM (e.g., results, gradients for certain distributed training setups).
- Why it matters for AI: Data needs to move between the CPU/RAM and the GPU. This transfer takes time and can be a bottleneck if not managed efficiently.
- What to watch for in Grafana:
- High and sustained PCIe Tx/Rx activity with low GPU load: This can be a major bottleneck. It means your GPU is spending a lot of time waiting for data to arrive or results to be sent back, rather than computing. This often happens if you're transferring data too frequently in small chunks.
- Spiky PCIe activity: Bursts are normal (e.g., when a new batch is loaded). The goal is to make these transfers as quick and infrequent as possible relative to computation time.
Share: